Using Drive-Time Analysis to Redesign Branch Sales Coverage
In today’s competitive distribution and manufacturing landscape, sales performance is no longer driven solely by product quality or pricing. How efficiently your sales teams are deployed geographically can make a measurable difference in revenue, customer satisfaction, and employee morale.
Yet many organizations still rely on outdated territory models ZIP-code boundaries, historical assignments, or simple radius-based coverage that fail to reflect real-world driving conditions. This is where drive-time analysis becomes a powerful, data-driven tool for redesigning branch sales coverage.
In this article, we’ll explore what drive-time analysis is, why it matters, and how organizations can use it to build smarter, more profitable sales coverage models.
The Hidden Cost of Poor Sales Coverage Design
Misaligned branch and sales coverage often shows up in subtle but costly ways:
Sales reps spending excessive time on the road
Overlapping territories between branches
Customers being served by the “wrong” branch
Inconsistent service levels across regions
Burnout among top-performing reps
While these issues may appear operational, they are strategic problems. Every extra hour spent driving is an hour not spent selling, servicing, or building relationships.
Drive-time analysis allows leaders to replace assumptions with actual travel reality.
What Is Drive-Time Analysis?
Drive-time analysis uses geographic data and road-network intelligence to calculate how long it actually takes to travel from one location to another factoring in:
Road types and speed limits
Traffic patterns
Urban vs. rural infrastructure
Physical barriers (rivers, mountains, restricted roads)
Unlike simple distance-based methods (e.g., “within 50 miles”), drive-time analysis focuses on time-based accessibility, which is what truly matters for sales coverage.
For example:
A customer 30 miles away on highways may be easier to reach than one 15 miles away through congested city roads.
Two branches may appear equidistant on a map but differ dramatically in actual service time.
Why Drive-Time Matters for Branch Sales Coverage
1. More Accurate Territory Boundaries
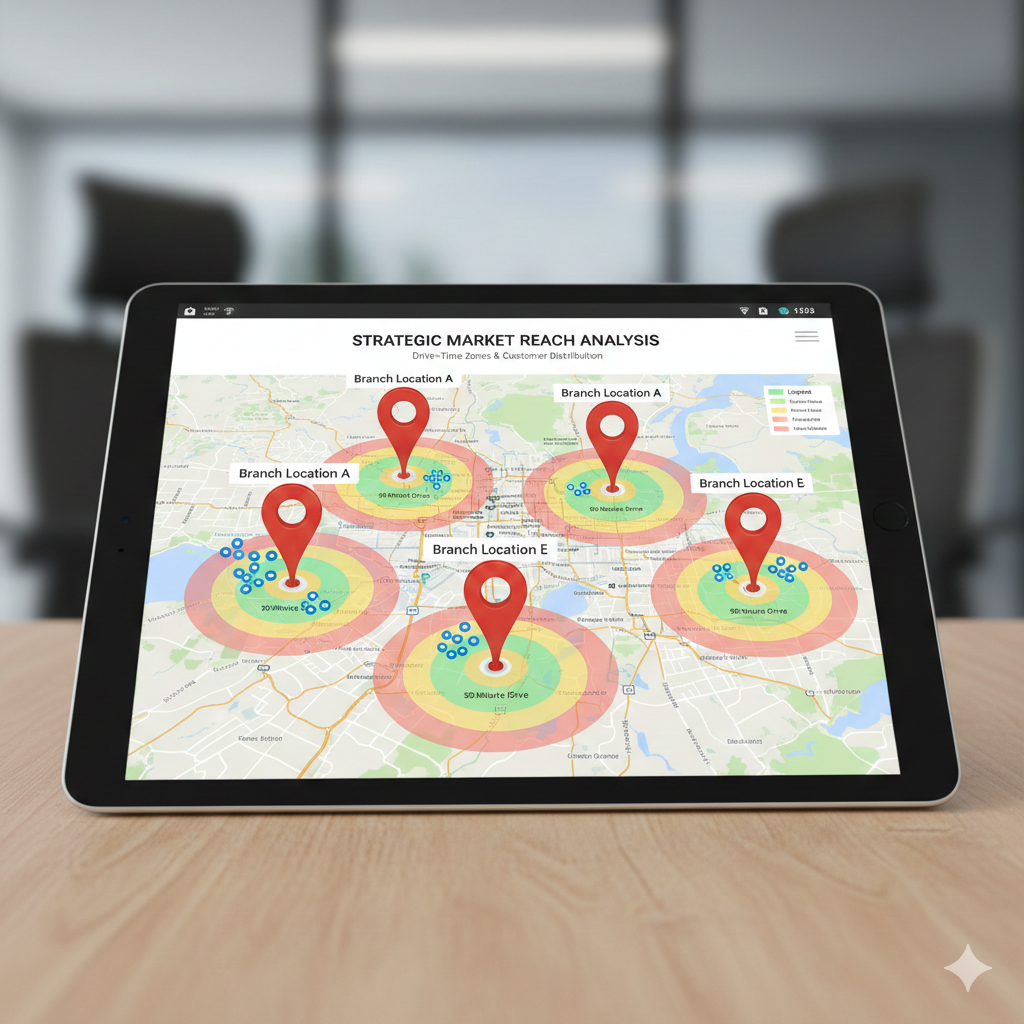
Traditional territory lines often ignore travel complexity. Drive-time analysis enables you to create isochrones boundaries based on equal travel time (e.g., 30, 60, 90 minutes).
This ensures:
Fairer workload distribution
More predictable daily schedules
Reduced overlap between branches
2. Improved Sales Productivity
When reps spend less time driving, they can:
Visit more accounts per day
Increase face-to-face selling time
Respond faster to customer needs
Over time, even small reductions in average drive time can translate into significant revenue gains.
3. Better Customer Experience
Customers care about:
Response time
Consistency
Local expertise
By assigning customers to the most accessible branch or rep, organizations improve service reliability and reduce frustration caused by delayed visits or misrouted requests.
4. Smarter Branch Utilization
Drive-time analysis often reveals:
Branches that are overloaded
Branches that are underutilized
Gaps in coverage where customers fall outside optimal service ranges
This insight supports data-backed decisions such as:
Rebalancing territories
Adjusting branch roles
Evaluating new branch locations
How Drive-Time Analysis Redesigns Sales Coverage
Step 1: Define Service Expectations
Start by aligning leadership on questions like:
What is an acceptable drive time for a routine visit?
Are service levels different for key accounts vs. smaller customers?
How often should reps realistically visit accounts?
Clear expectations guide the entire modeling process.
Step 2: Map Branches, Customers, and Reps
Using GIS-enabled tools, organizations map:
Branch locations
Customer addresses
Sales rep home bases (when relevant)
This creates a single source of geographic truth.
Step 3: Generate Drive-Time Zones
Drive-time zones replace arbitrary borders with realistic service areas, often segmented into:
Primary coverage (e.g., ≤45 minutes)
Secondary coverage (e.g., 45–75 minutes)
Out-of-range accounts
These zones help leaders see where coverage is efficient—and where it’s not.
Step 4: Optimize Territory Assignments
With visibility into travel times, organizations can:
Reassign customers to closer branches
Reduce cross-branch overlap
Balance account loads across reps
This step often reveals “quick wins” that immediately improve efficiency without adding headcount.
Step 5: Stress-Test Scenarios
Drive-time analysis allows leaders to simulate “what-if” scenarios, such as:
Adding or closing a branch
Reassigning a sales team
Entering a new market
This removes guesswork and supports confident decision-making.
Common Mistakes to Avoid
Even data-driven initiatives can fall short if not executed carefully. Common pitfalls include:
Ignoring rep capacity while optimizing geography
Focusing only on averages instead of worst-case drive times
Failing to involve sales leadership in design decisions
Treating the model as static instead of revisiting it annually
Drive-time analysis works best when combined with sales performance data and operational insight.
Where Drive-Time Analysis Delivers the Most Value
Organizations see the strongest impact when they:
Operate multi-branch or regional sales networks
Serve customers across large or congested geographies
Have grown through acquisitions with overlapping territories
Experience inconsistent sales performance across regions
In these environments, drive-time analysis becomes a strategic lever, not just a mapping exercise.
Final Thoughts
Redesigning branch sales coverage is no longer about intuition or legacy boundaries. Drive-time analysis brings reality into the equation, enabling organizations to align sales effort with how people actually move through the world.
When done right, it leads to:
Higher sales productivity
Happier customers
More sustainable growth
Ready to Rethink Your Sales Coverage?
At Intuitico, we help distribution and manufacturing organizations use data analytics to design smarter sales territories, optimize branch coverage, and improve performance across their networks.
Visit our homepage: https://www.intuitico.io
Or email us at “will.chen@intuitico.io“directly to start the conversation.
For a free 30 minutes consultation, you can book a meeting using this link:
https://calendly.com/will-chen-intuitico/30min