Increasing Fill Rates with Better Inventory Classification (ABC / XYZ / Seasonality Models)
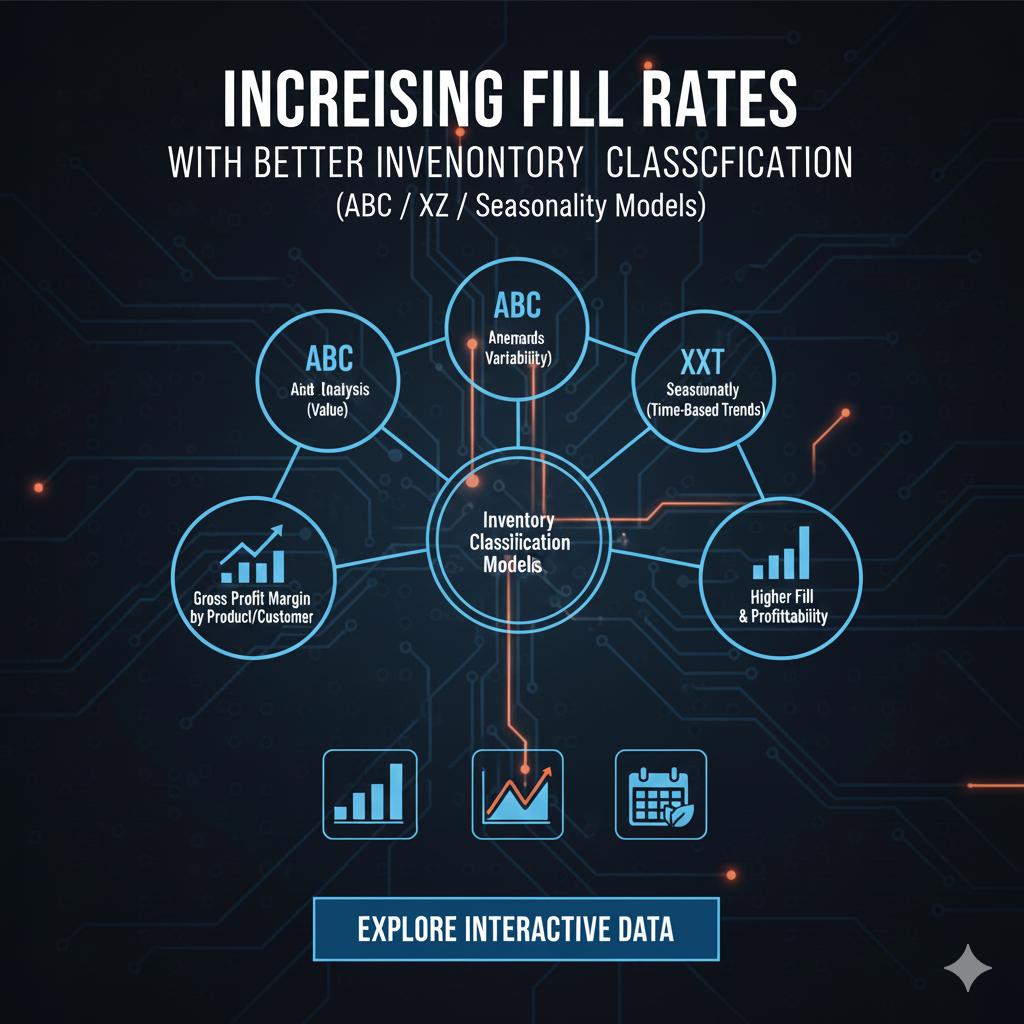
How smarter segmentation turns inventory data into higher service levels, lower stockouts, and healthier margins.
Introduction
In today’s supply chains, fill rate is one of the clearest indicators of operational excellence. Whether you are a building materials distributor, manufacturer, or wholesaler, customers expect products to be available when they need them. Missed fill rates don’t just result in lost sales they erode trust, push customers to competitors, and inflate operational costs through expediting and firefighting.
Yet many organisations still manage inventory using one-size-fits-all rules. The reality is that not all SKUs behave the same. Some drive most of the revenue, some are highly predictable, while others are seasonal or erratic. Treating them equally is one of the fastest ways to create stockouts and excess inventory at the same time.
This is where inventory classification models - ABC, XYZ, and Seasonality analysis - become powerful levers for increasing fill rates without simply carrying more stock.
Why Fill Rates Suffer Despite “Enough” Inventory
Many companies assume that low fill rates mean insufficient inventory. In practice, the problem is usually misallocated inventory.
Common causes include:
High-value SKUs being understocked
Slow-moving items consuming working capital
Volatile-demand items forecasted like stable products
Seasonal spikes treated as anomalies rather than patterns
Better classification allows businesses to prioritise the right inventory decisions for the right SKUs, directly improving service levels.
ABC Classification: Focus Where It Matters Most
ABC analysis segments inventory based on business impact, typically revenue or margin contribution.
A-items: ~10–20% of SKUs generating ~70–80% of revenue
B-items: Moderate importance, stable contributors
C-items: High SKU count, low revenue impact
How ABC Improves Fill Rates
By identifying A-items, organisations can:
Apply tighter safety stock policies
Review forecasts more frequently
Prioritize replenishment and supplier reliability
Instead of spreading attention evenly, teams focus effort where stock outs hurt the most.
XYZ Classification: Managing Demand Variability
While ABC looks at importance, XYZ classification focuses on predictability.
X-items: Stable, predictable demand
Y-items: Moderate variability or trend-based demand
Z-items: Highly volatile or sporadic demand
Why Variability Impacts Fill Rates
Applying the same forecast model to X and Z items is a common mistake. Z-items often cause:
Chronic stockouts
Excess safety stock that still fails
Poor forecast accuracy metrics
By classifying demand behavior, businesses can:
Use statistical forecasting for X-items
Apply trend and causal models for Y-items
Shift Z-items to make-to-order, MOQ-based, or service-level driven strategies
This alignment significantly reduces surprise stockouts.
Seasonality Models: Planning for What You Already Know Is Coming
Seasonality is often visible in hindsight but ignored in planning.
Examples include:
Construction materials peaking in warmer months
Retail products tied to holidays
Project-based demand cycles
Turning Seasonality into Higher Fill Rates
Seasonality-aware classification enables:
Pre-build strategies before demand spikes
Dynamic safety stock adjustments
Supplier alignment ahead of peak periods
Instead of reacting to demand surges, organisations anticipate and prepare, preserving fill rates even during high-volume periods.
Combining ABC + XYZ + Seasonality: The Real Advantage
Individually, each model adds value. Combined, they create a multi-dimensional inventory strategy.
For example:
AX Seasonal: Mission-critical SKUs requiring proactive pre-builds
CZ Non-seasonal: Candidates for rationalisation or on-demand sourcing
BY Seasonal: Moderate importance but timing-sensitive items
This layered approach allows companies to:
Allocate capital more effectively
Improve fill rates without bloating inventory
Align operations, procurement, and sales around shared priorities
Technology and Data: Making Classification Actionable
Manual ABC or XYZ analysis done once a year quickly becomes outdated. Modern operations require:
Automated SKU classification
Continuous demand pattern monitoring
Integration with ERP and planning systems
At Intuitico, we help organisations move from static spreadsheets to dynamic, data-driven inventory classification, ensuring that fill rate improvements are sustained not temporary.
Key Takeaways
Low fill rates are often a classification problem, not a stock problem
ABC focuses effort on revenue-critical SKUs n- XYZ aligns planning with demand variability
Seasonality models prevent predictable stock outs
Combined classification drives higher service levels with lower working capital
Ready to Improve Your Fill Rates?
If your organisation is struggling with stock outs, excess inventory, or inconsistent service levels, better inventory classification is a proven starting point.
Visit our website: https://www.intuitico.io
Email us at “will.chen@intuitico.io“ to learn how data-driven inventory strategies can unlock higher fill rates and stronger margins.
For a free 30 minutes consultation, you can book a meeting using this link:
”https://calendly.com/will-chen-intuitico/30min”